
Building a Smarter Way to Manage Estates and Pay Bills
Role
Sole Product DesignerTimeline
Feb 2025 - Jul 2025Industry
Fintech
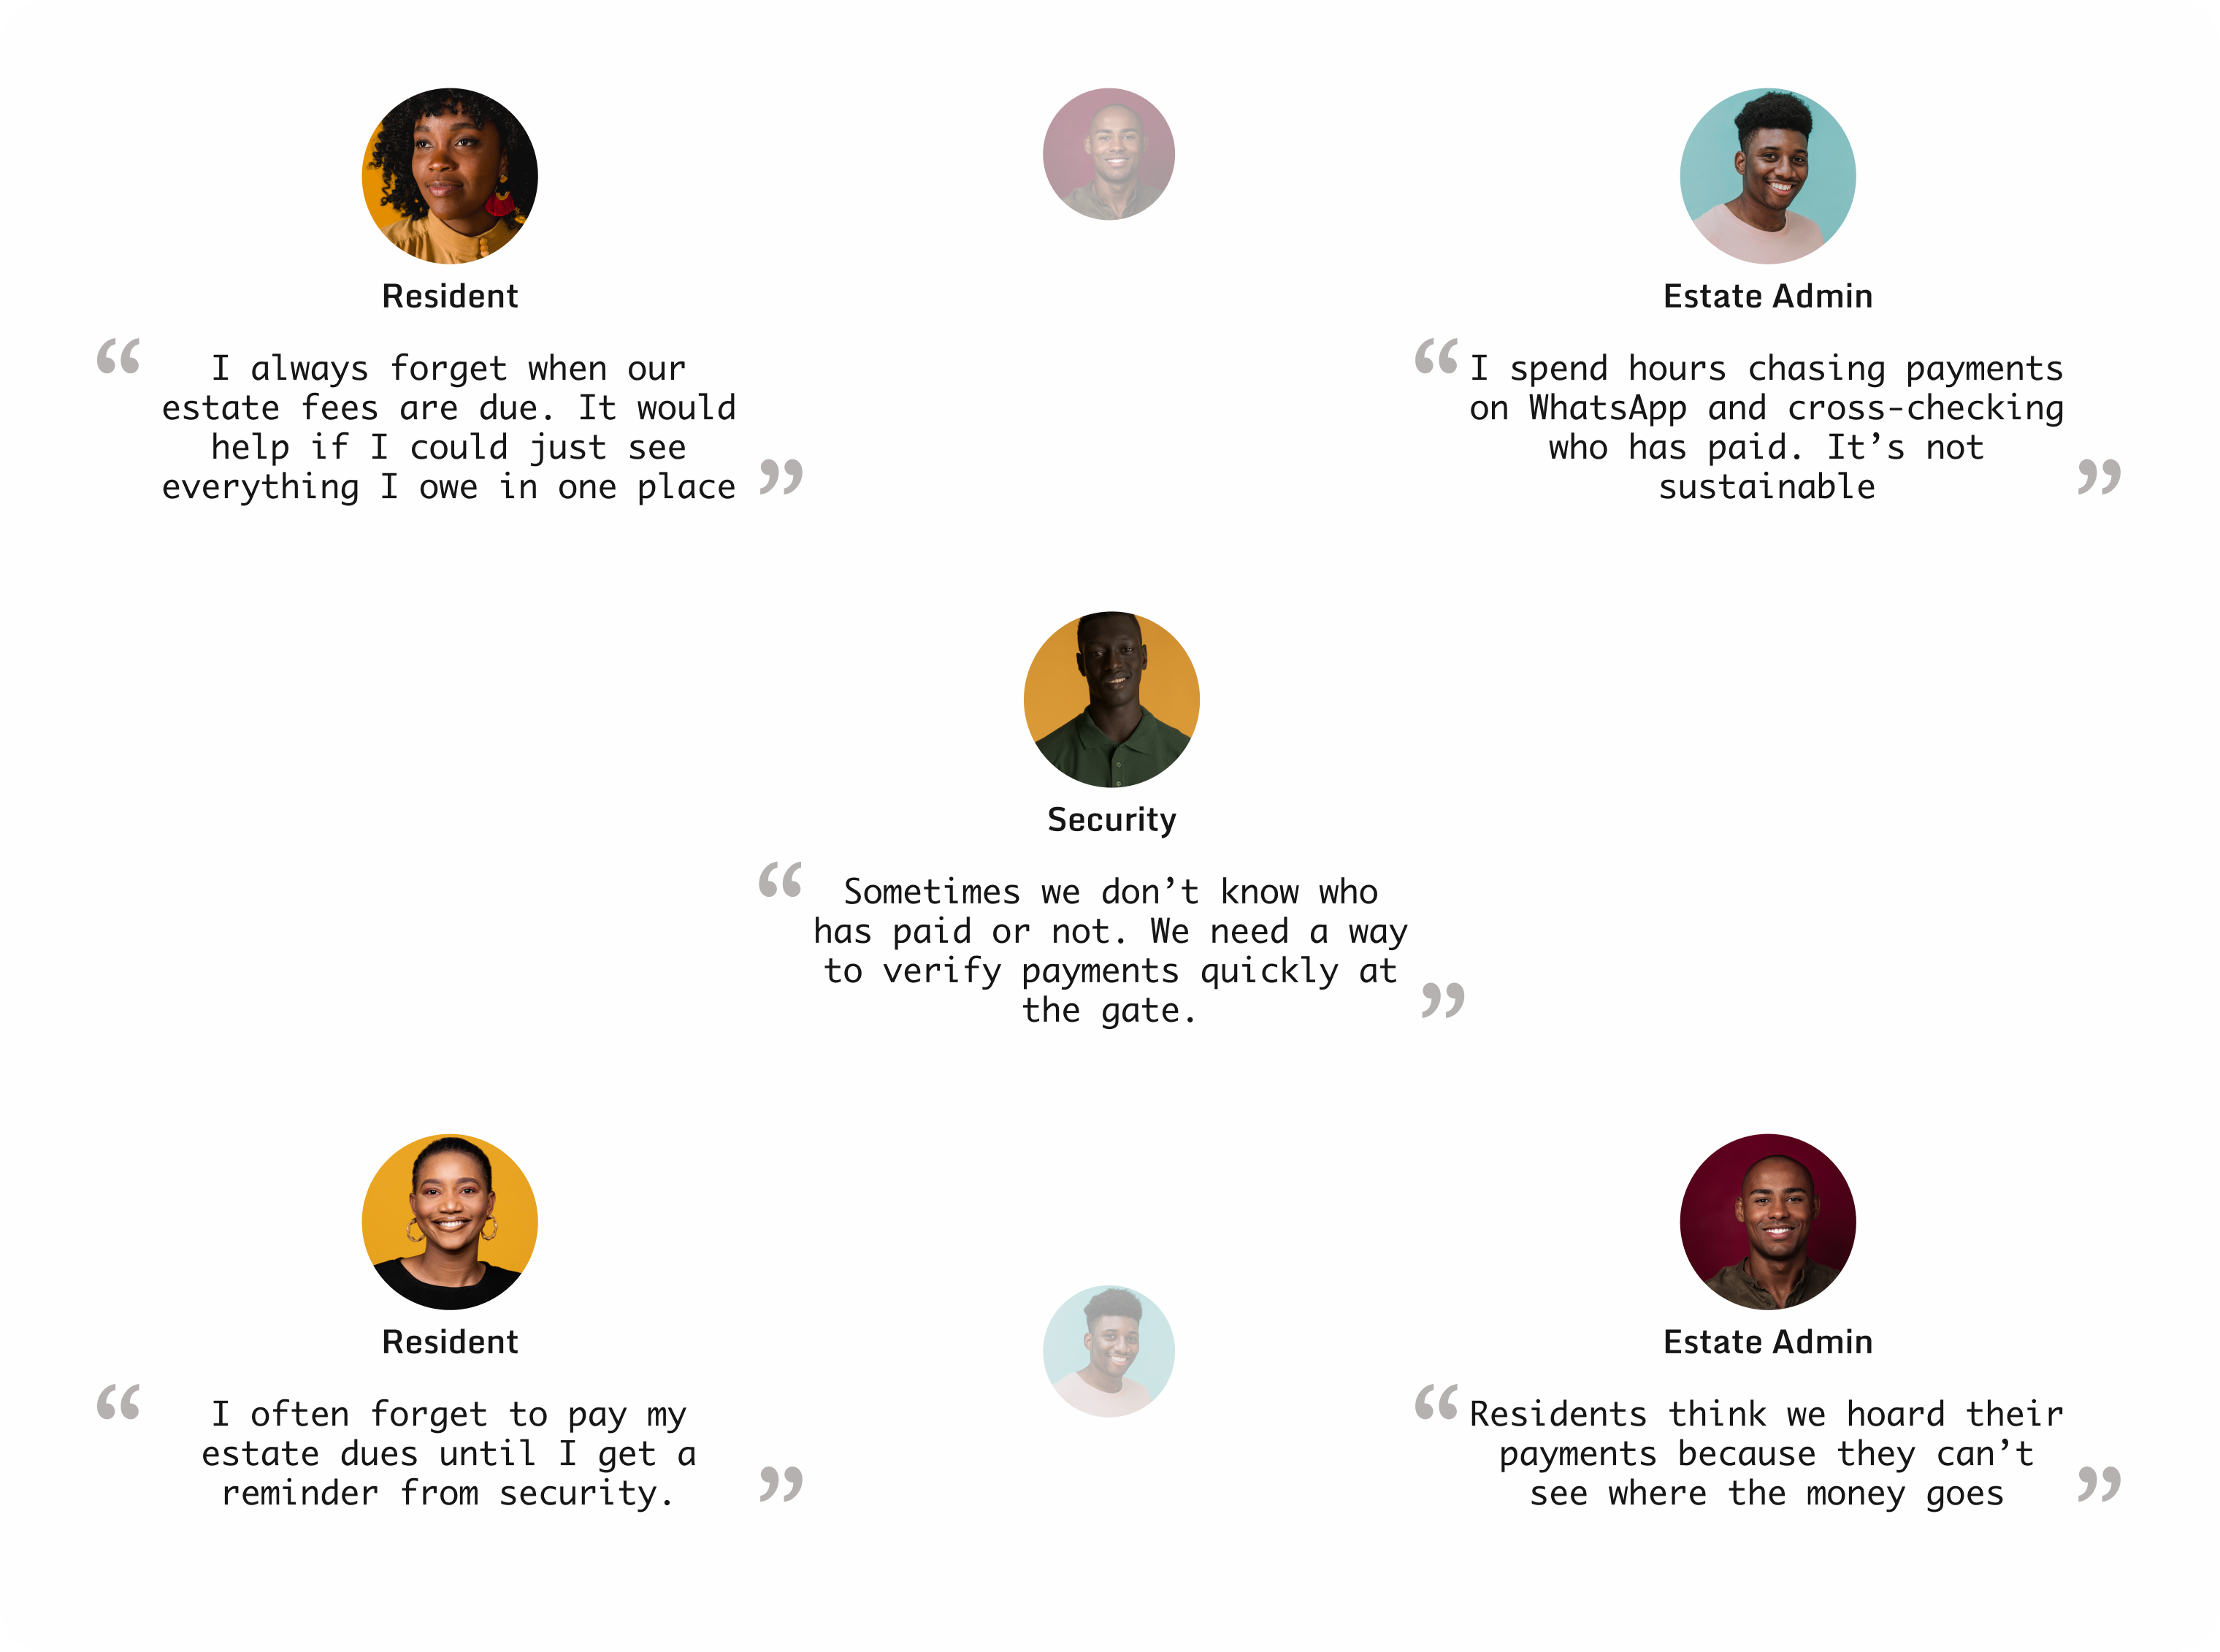
“How can we simplify estate payments without disrupting existing trust structures?”
- User Experience Gaps: Most competitor platforms focus heavily on functionality without considering how intuitive navigation should feel. Users often have to click through several screens to complete actions that should take seconds. KoboSmart bridges this by designing shorter, more predictable flows.
- Fragmented Solutions: Sesa excels at communication and dues tracking, while Clannit handles gate access control. However, neither offers a comprehensive solution that manages both finances and community operations in one environment. KoboSmart fills this gap by providing a unified ecosystem for all estate-related needs.
- Lack of Automation and Transparency: Competing platforms rely on manual updates or external confirmation steps for dues and settlements. KoboSmart automates recurring payments, ledger updates, and settlements, which improves accountability between residents and admins.
- Security and Role Limitations: Clannit focuses mainly on visitor management, while Sesa lacks role differentiation entirely. KoboSmart introduces layered roles: Resident, Admin, Security, and Super Admin, ensuring that each user type sees only what they need, minimizing confusion and maintaining data security.
- Unrefined Reporting Systems: Reporting in competitor products is basic or non-existent. KoboSmart’s analytics and settlement features allow estate admins and super admins to understand payment patterns, outstanding balances, and estate performance in real time.
- Unrefined Reporting Systems: Reporting in competitor products is basic or non-existent. KoboSmart’s analytics and settlement features allow estate admins and super admins to understand payment patterns, outstanding balances, and estate performance in real time..
User Story
As a resident, I want to view and pay my estate bills easily, so I can stay compliant without stress.User Story
As an estate admin, I want to track which residents have paid or are owing, so I can maintain transparency and accountability.User Story
As a security officer, I want to confirm the payment status of residents, so I can enforce access policies fairly.- Seamless Navigation: Navigation had to be effortless across mobile and web. I tailored experiences for estate admins, residents, and security officers, focusing on intuitive hierarchies and consistent visual cues to minimize learning time.
- Accessibility Standards: KoboSmart's design prioritized accessibility and user confidence, not just aesthetics. I adhered strictly to WCAG guidelines, ensuring every element, from colour contrast to button placement, reinforced the principle that clarity builds trust.
- Security Features: Security and privacy were central. Features like BVN/NIN verification, encrypted transactions, and consent modals were seamlessly integrated. The design ensured users always understood data usage, reinforcing trust in the system.
- Business-Centric Design: The design philosophy was business-centric, balancing functionality with financial responsibility. The interface allowed admins to clearly monitor settlements, track bills, and analyze collections, prioritizing operational efficiency.
- Team Alignment: One of the biggest challenges was maintaining alignment across a distributed team of designers, developers, and business stakeholders. Everyone had different priorities, and bringing those perspectives together required frequent communication and collaboration. It was not enough to simply share designs. We had to ensure that each decision reflected both user needs and technical realities.
- Role Consistency: Residents, estate admins, and security users all interacted with the app differently, yet the experience needed to feel consistent. We approached this by defining clear interaction boundaries for each group. Residents focused on payments and community updates, security users handled verification tasks, and estate admins oversaw analytics and management. Every interface had to feel intuitive on its own while still belonging to the same product ecosystem.
- Technical Constraints: Integrating real-time payment systems came with unexpected constraints, especially when certain APIs could not support the desired level of interaction. Instead of compromising the user experience, I collaborated closely with developers to identify alternative workflows that preserved intent and usability.
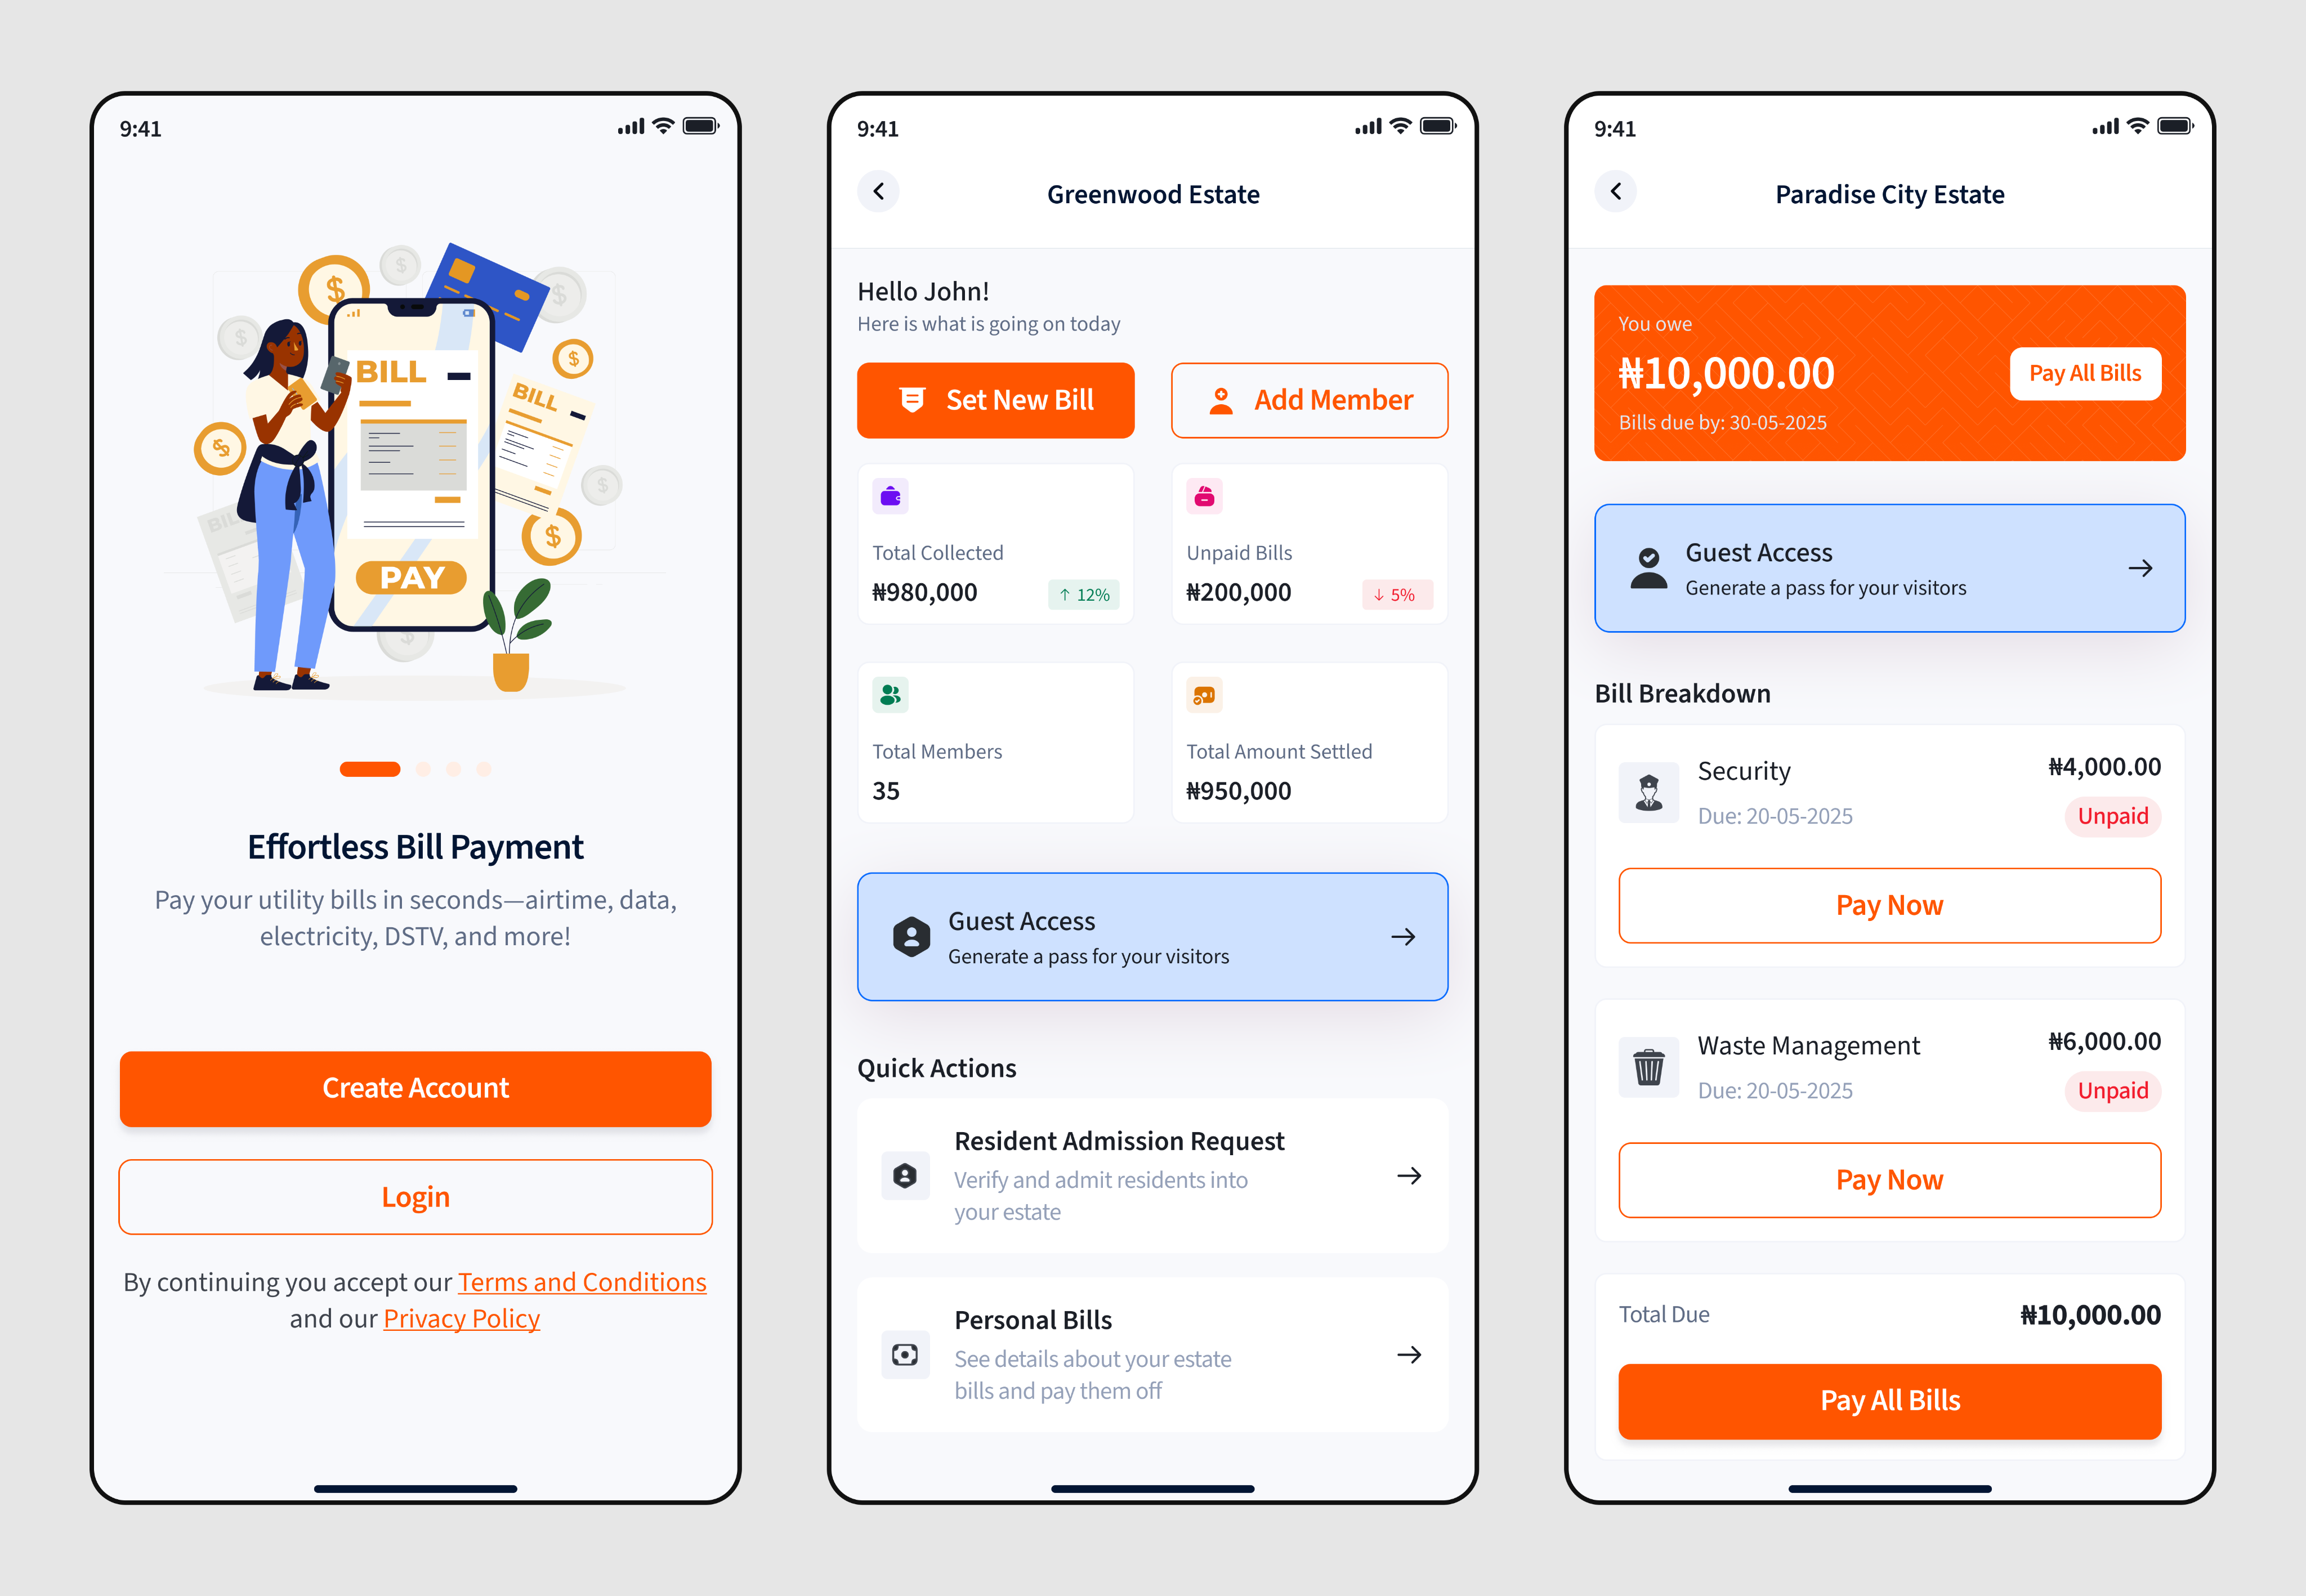
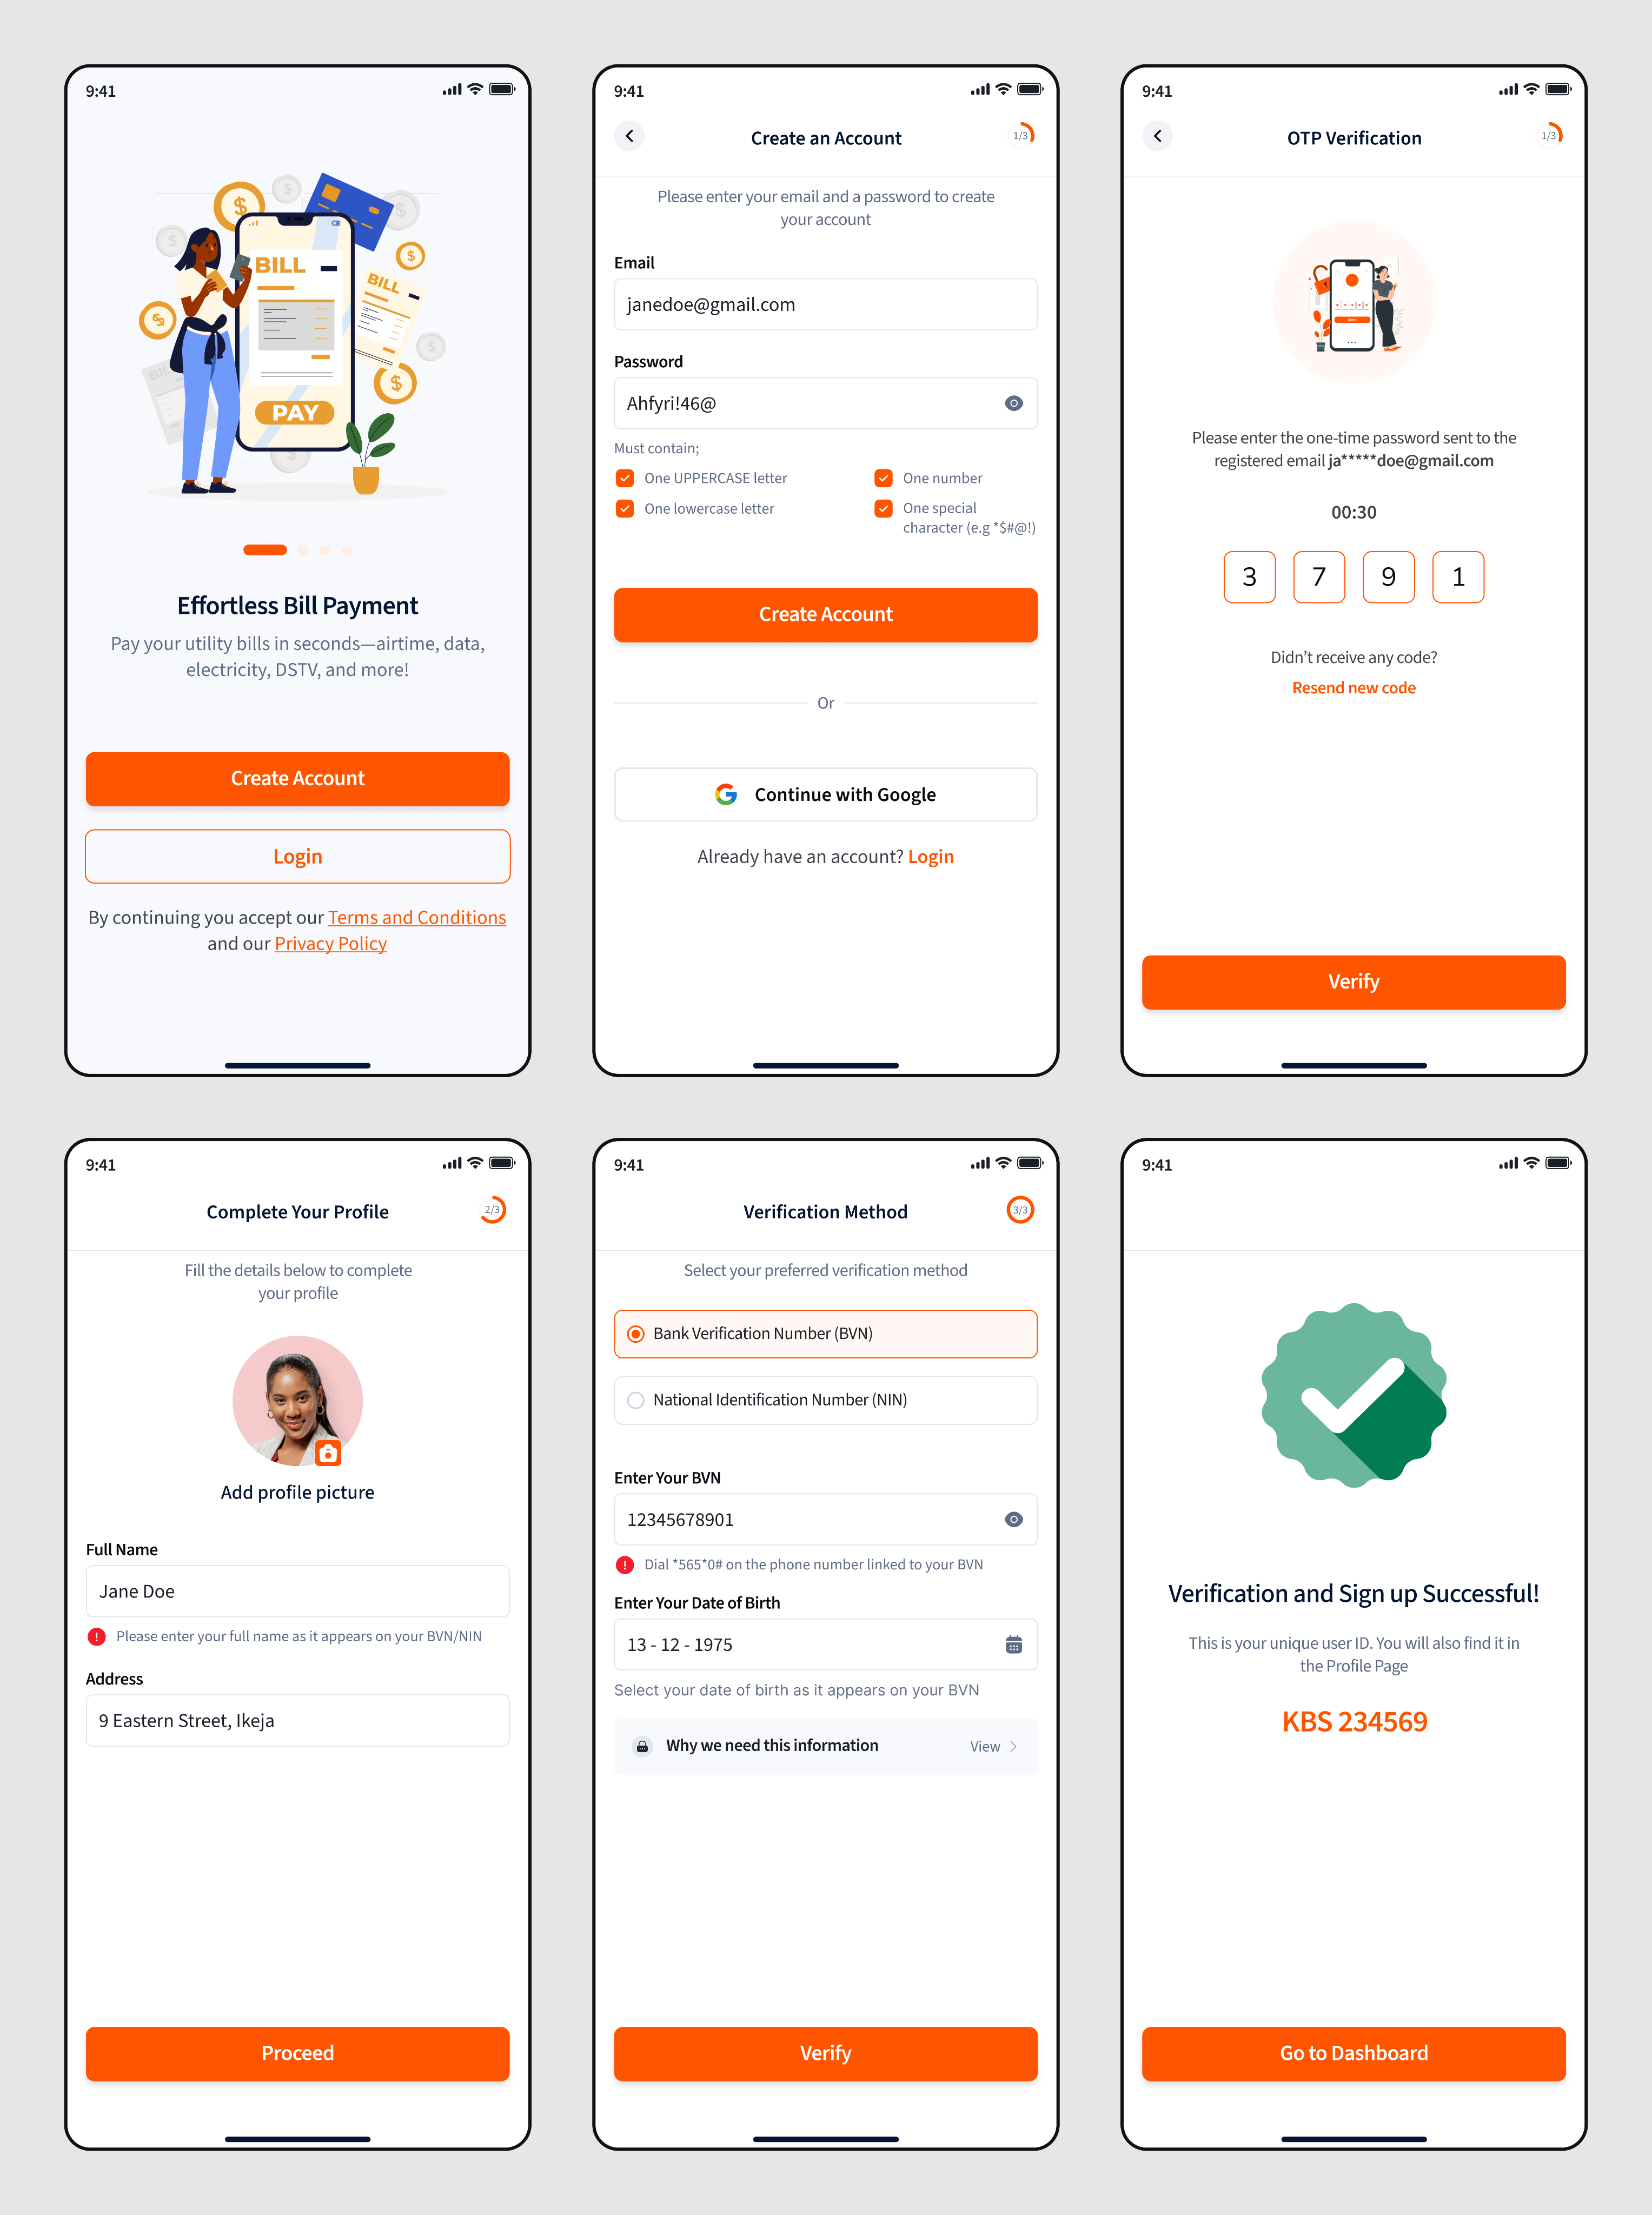
Welcoming Start: A friendly splash screen explains KoboSmart helps you pay bills effortlessly, with clear “Create Account” and “Login” options.
Smooth Registration: Minimal input fields (email and password) with clear password validation and Google sign-in for easy access.
Secure Verification: OTP confirmation ensures user authenticity, with an option to resend the code if needed
Profile Setup: Users add personal details like name, photo, and address to personalize their account and enable estate linking later.
Identity Verification: Users verify their BVN or NIN by matching their full name and date of birth, promoting accuracy and compliance.
Confirmation and Onboarding Complete: A success screen with a unique KoboSmart ID and a single “Go to Dashboard” button finalizes onboarding, reinforcing trust and readiness.
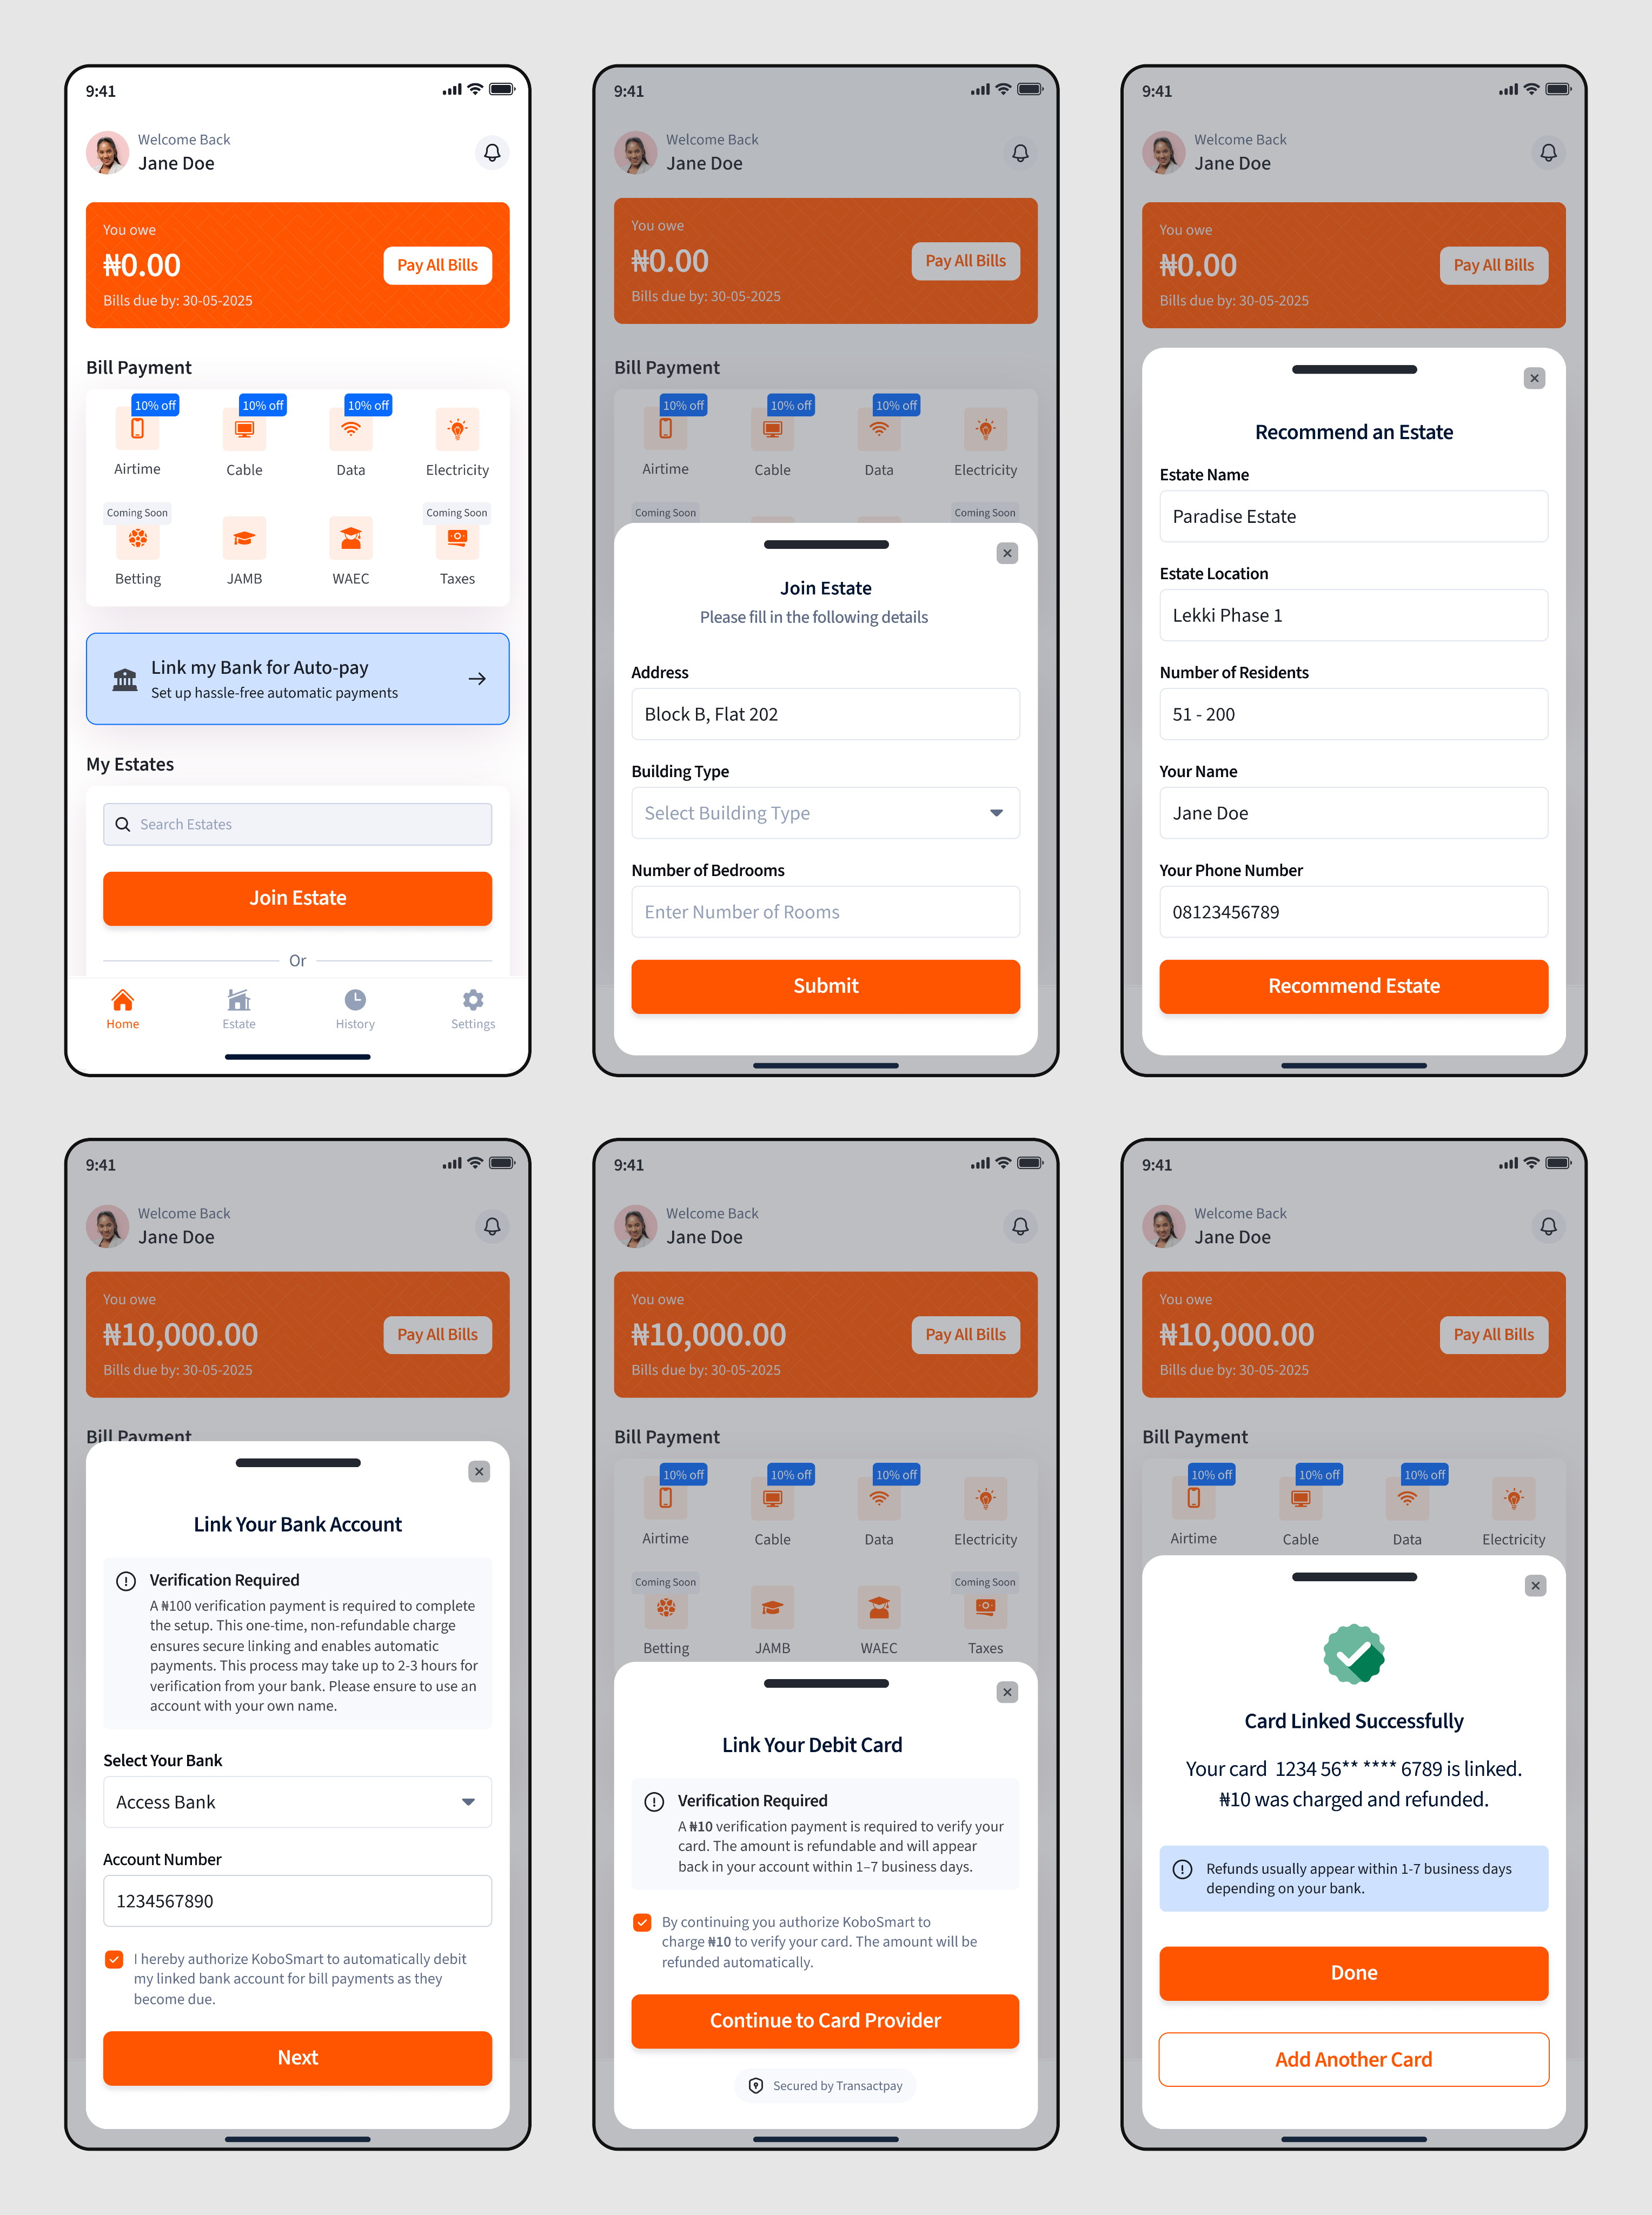
Estate Bill Overview: The top section clearly displays the total amount of estate bill owed and due date, with a bold “Pay All Bills” button for quick payment.
Categorized Bill Options: Icons for Airtime, Cable, Data, and Electricity are neatly grouped, with badges like “10% off” to encourage engagement. Upcoming features like Betting and Taxes are marked as “Coming Soon.”
Estate Management: Residents can easily join an existing estate or recommend a new one. The forms for joining capture essential details such as address, building type, and number of bedrooms.
Linking Card for Auto-Pay: Users can link their bank account or debit card to enable automatic payments. A clear verification process is explained, including the one-time ₦100 validation charge and refund.
Seamless Verification Flow: The design builds user trust through step-by-step prompts that confirm successful account linking with friendly visuals and clear feedback.
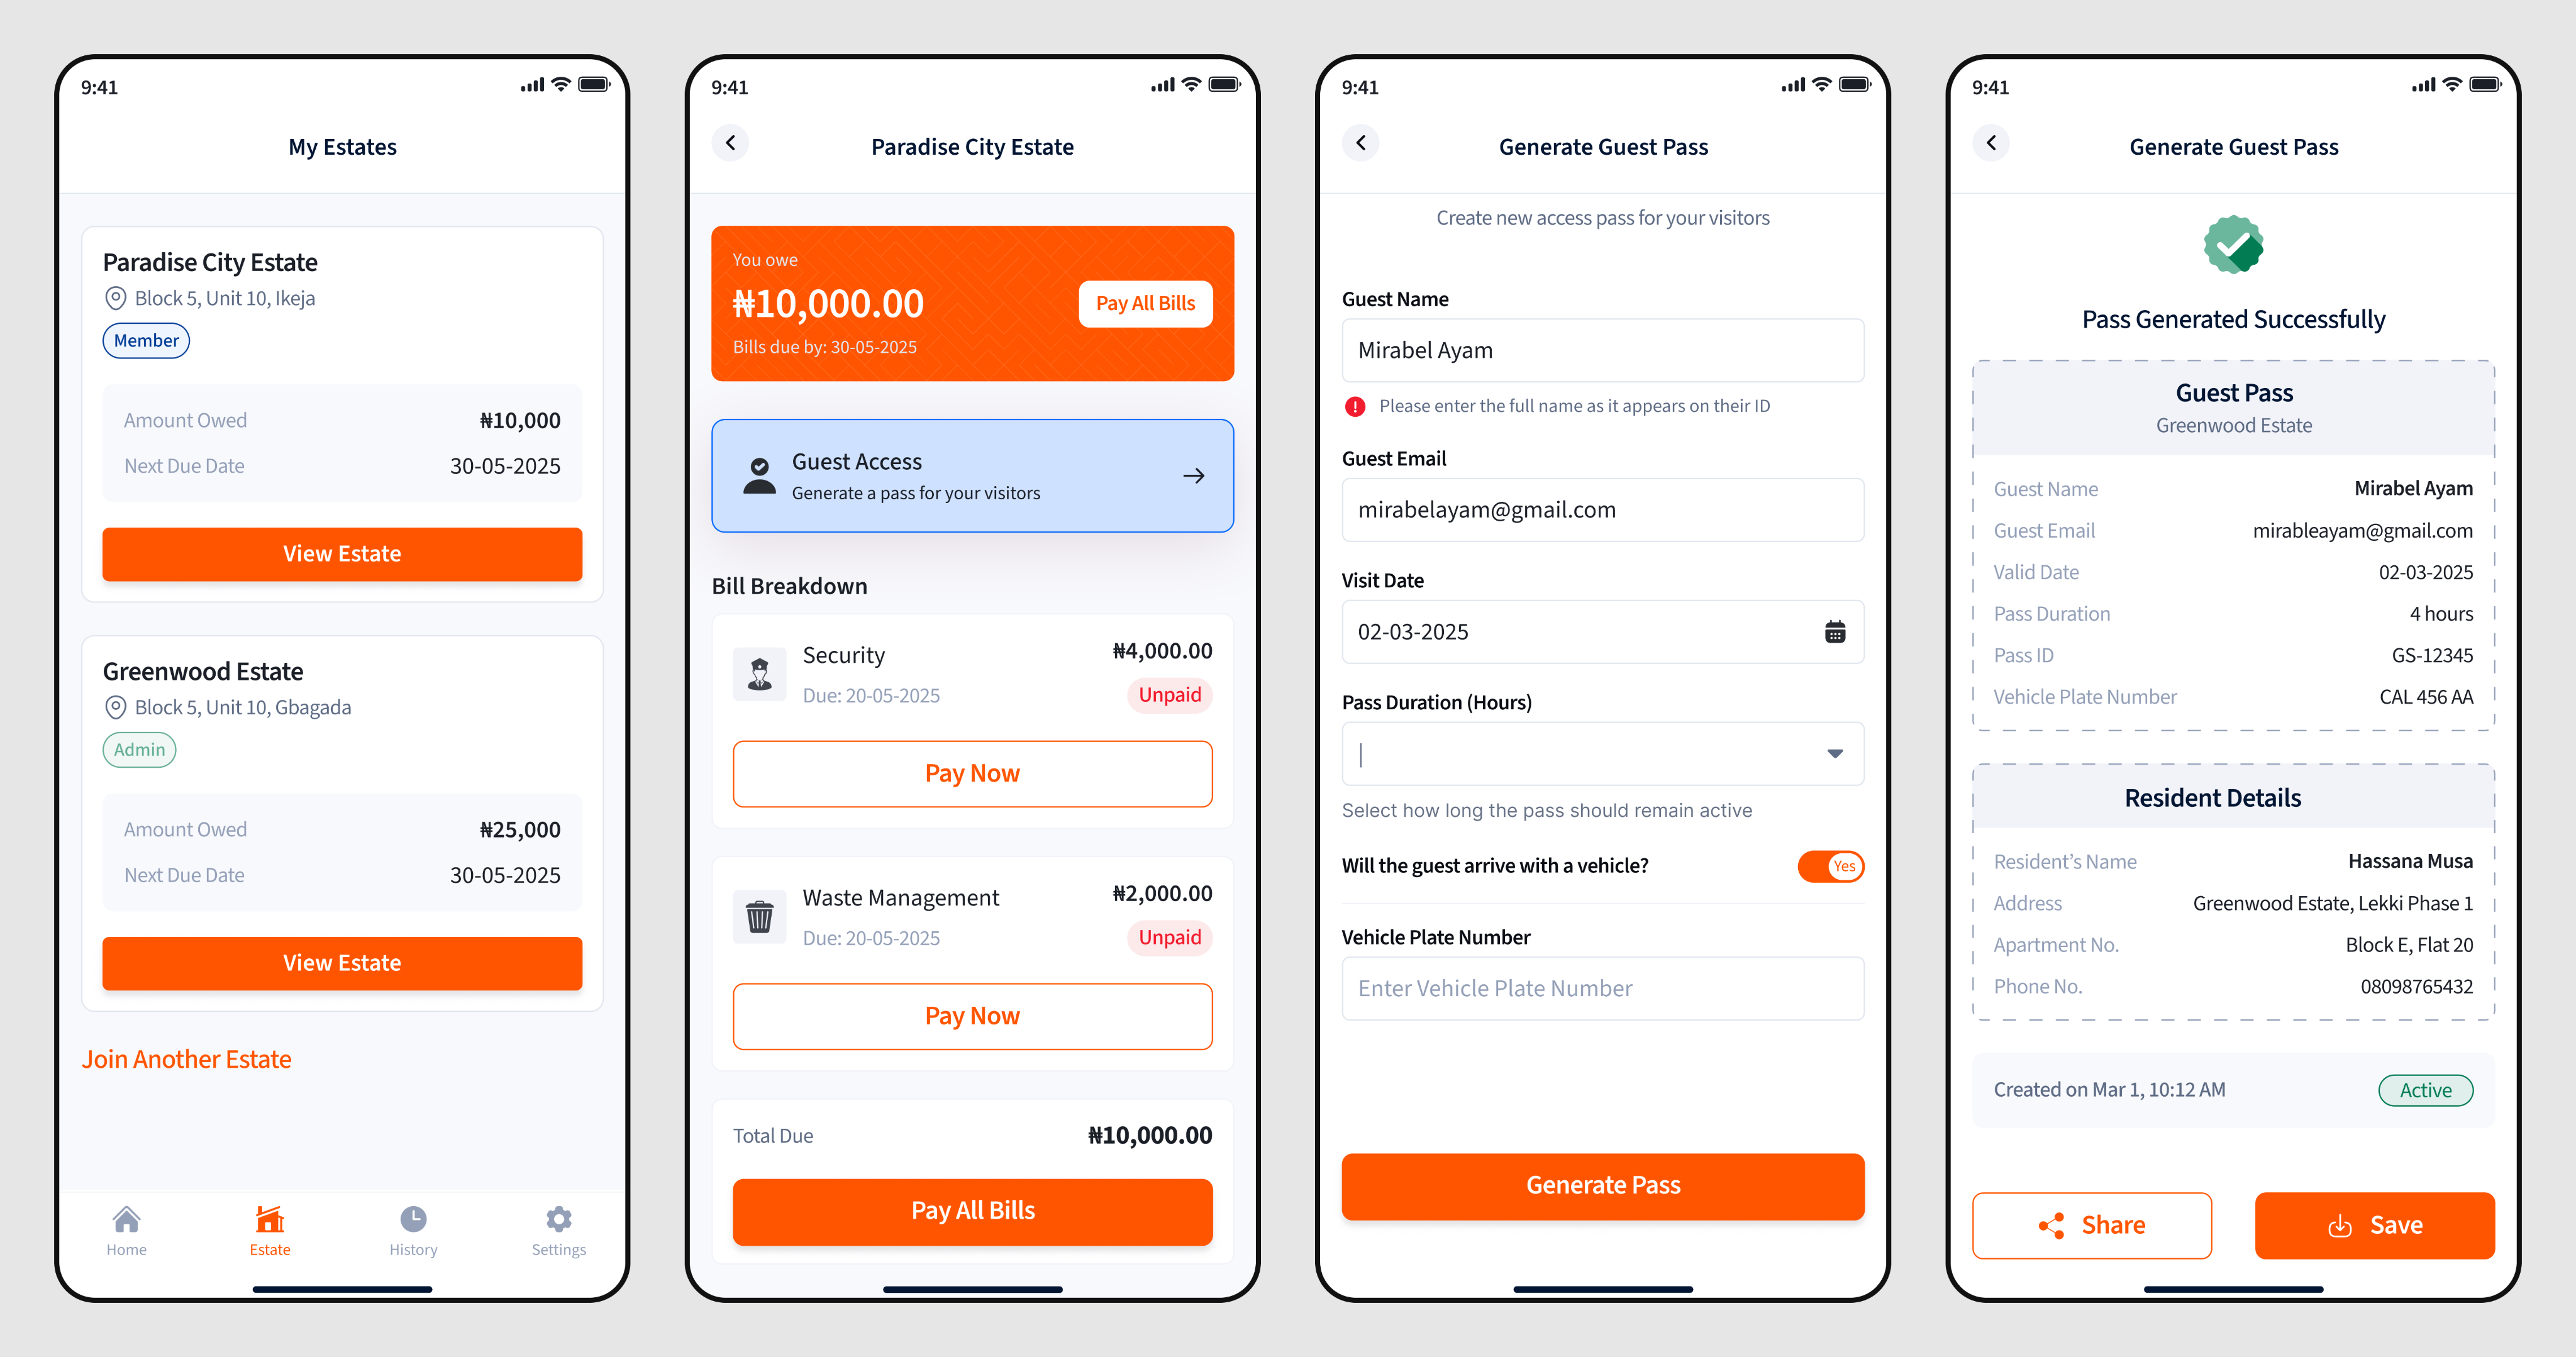
Multi-Estate Management: Residents can belong to multiple estates. The “My Estates” screen allows easy switching between estates, showing at a glance how much is owed and the next due date.
Clear Role Identification: Each estate clearly indicates the user’s role (for example, Member or Admin) ensuring transparency in permissions and accessible features.
Transparent Bill Breakdown: The estate dashboard displays an itemized bill summary (e.g., electricity, waste management) with due dates and payment statuses for each item.
Guest Access Control: Users can generate digital guest passes by entering visitor details (name, email, vehicle plate, visit duration). This improves estate security and visitor tracking.
- A resident paying an electricity bill and setting up recurring payments.
- An estate admin creating a new monthly bill.
- A security officer validating a guest pass.
- A super admin reviewing estates and approving new admins.
- A resident requesting to join an estate through the app.
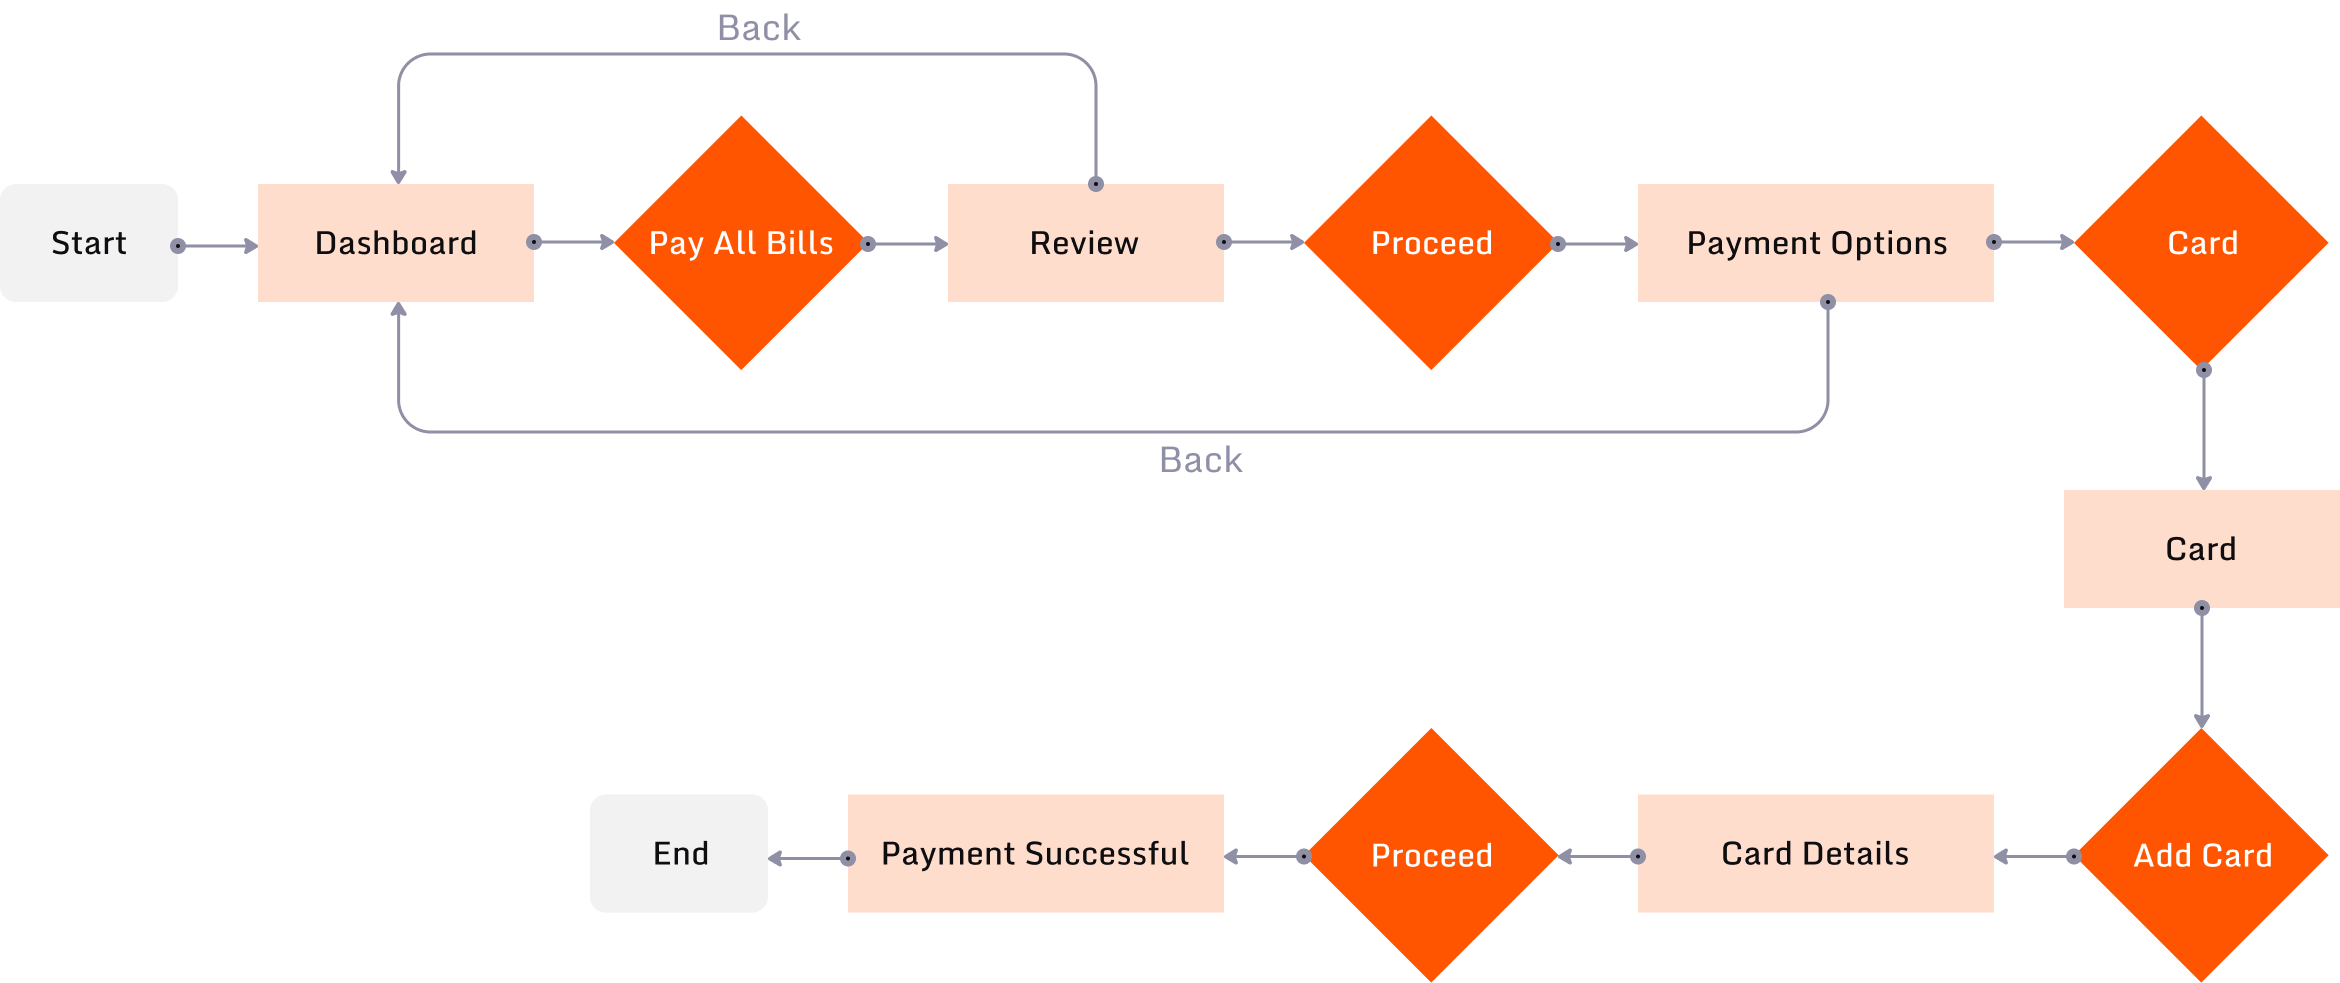
- Information Hierarchy Mattered: Many users hesitated during the bill payment flow because the amount summary appeared below the payment options. We moved the summary higher up and added a confirmation step that improved clarity.
- Positive Feedback on Flow: Across all roles, testers appreciated how the system reflected real estate hierarchies and transactions, saying it felt “easy to use” and “well thought-out.”
View the website here
Project Idea
Project Direction
